By Margaret Kashuba
For most PPC specialists, reporting is not their favorite part of their work. However, you have to build the necessary reports to align your activities with those of the marketing team and prove your results. Depending on your PPC tools, you’ll have a few internal reports in your advertising accounts. But typically they aren’t enough for serious reporting.
Useful PPC reports should contain data on:
- PPC-generated traffic
- PPC-generated customer behavior
- Costs
- Keywords
- Campaigns
- Conversions
- Purchases/revenue
- ROAS
PPC tools rarely have access to all the data mentioned above in order to build any reports you might need. Typically, this data is spread across different advertising accounts, Google Analytics, your CRM, etc. To deal with this, you have to merge all your data into a single storage. You can do that automatically with the help of a third-party service like OWOX BI Pipeline, or you can manually update your PPC templates each time you need to generate a report by downloading data from separate services and merging it.
By the way, templates are very helpful for reporting, as you can make your own to fit your needs. You can even connect a few templates into a thematic PPC dashboard, which is the dream of every PPC specialist. One of the most popular dashboard builders is Google Data Studio (here’s a brief tutorial for beginners). We show some examples of Data Studio dashboards below. But before looking at them, let’s start with basic reports any specialist can find in Google Analytics.
ROAS tracking in Google Analytics
Return on ad spend, or ROAS, is a basic but very useful metric you can see in your Google Analytics reports after adding cost data, adding CRM data from your PPC services, and tuning the Ecommerce feature in Google Analytics. Google Ads has native integration with Google Analytics, which means cost data from Google Ads can be updated in Google Analytics automatically. However, this doesn’t work for non-Google services. For third-party services, you can use detailed instructions by OWOX for uploading cost data to Google Analytics.
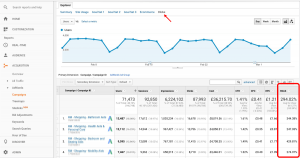
One more reason to add Google Ads to Google Analytics is that you’ll get a whole bunch of PPC reports in a dedicated Google Analytics menu:
After linking your Google Ads and Google Analytics accounts, you’ll see that the ROAS column gets new values. But that’s enough only if you run ads exclusively in Google services. If you run ads elsewhere, you’ll have to add data from your other advertising services.

Source: Megalytic blog
You should pay attention to keep ROAS above 300% so you can be sure you aren’t wasting your money. If your budget is reasonably large and you have lots of campaigns, be sure to check your ROAS metrics at least once every few days. This will help you avoid wasting your budget on inefficient campaigns.
Traffic source/medium report in Google Analytics
This report will help you analyze your PPC channel separately and in comparison with other channels. As a PPC specialist, it’s extremely important that you keep pace with other marketers and freely exchange information about successes and failures. Check your conversion rate and track all anomalies to control the health of your PPC channel. Sometimes, it’s easier to decrease costs for some keywords with improved SEO or better advertising copy than it is to pay the higher cost of advertising in a PPC auction. And you’ll never maximize your conversions if PPC traffic is pouring onto low-quality landing pages.

Source: Online Metrics
Make your campaigns trackable by using UTM tags and correct keyword groupings. Align your strategy across organic, social, and email channels and you’ll see the results of your work.
But even Google Analytics won’t give you the whole picture. If you want to go deeper in your analysis, you have to analyze PPC-generated traffic throughout the customer journey and your marketing funnel. To do that, you have to work with data like a data scientist (or ask your analyst to help) and set up an automated real-time PPC dashboard. This can be a standalone dashboard or a separate page of your general marketing dashboard.
PPC section of the funnel report/dashboard or separate PPC dashboard
This is what your PPC dashboard might look like:

Source: OWOX Demo Dashboard
Here’s another example from Adalysis:

The biggest benefit of such a dashboard is that you don’t have to click on thousands of tabs to get deep insights into what’s going on or how your campaigns are doing. Just set up the dashboard once and use it until your needs change.
With a PPC page within your general marketing dashboard, you’ll be able to compare your PPC funnel with funnels for other channels. This is a great way to prove that your efforts are fruitful — and even to get a promotion.
Summing up
Analytics makes your marketing more efficient and controllable. It decreases your costs and improves your results, making your whole company better off. Starting from Google Analytics and ending with big dashboards based on consolidated data, you’re now ready to do your best PPC reporting!
Margaret Kashuba is a Chief Marketing Officer of OWOX BI, marketing analytics service that consolidates data from disparate systems, evaluates the performance of advertising campaigns, and quickly builds the reports you need. OWOX developed an easy to use product that allows marketers to get any reports without SQL syntax with the help of a report builder.


